Turn Restaurant Data Into Decisions With BI Insights


Running a multi-location restaurant business means managing a constant flow of information — from sales numbers and labor costs to scheduling and overtime trends. The challenge isn’t collecting this information; it’s making sense of it.
Most operators rely on a mix of POS reports, spreadsheets, payroll data, and scheduling tools, which provide only pieces of the puzzle. Pulling reports across multiple locations often requires hours of manual work, and by the time the analysis is done, the opportunity to act on those insights may have already passed.
This is where business intelligence can make a real difference.
With the launch of BI Insights, Push Operations is giving restaurant operators a powerful way to transform operational data into clear, visual dashboards that support smarter decision-making across every location.
A Smarter Way to See Your Business
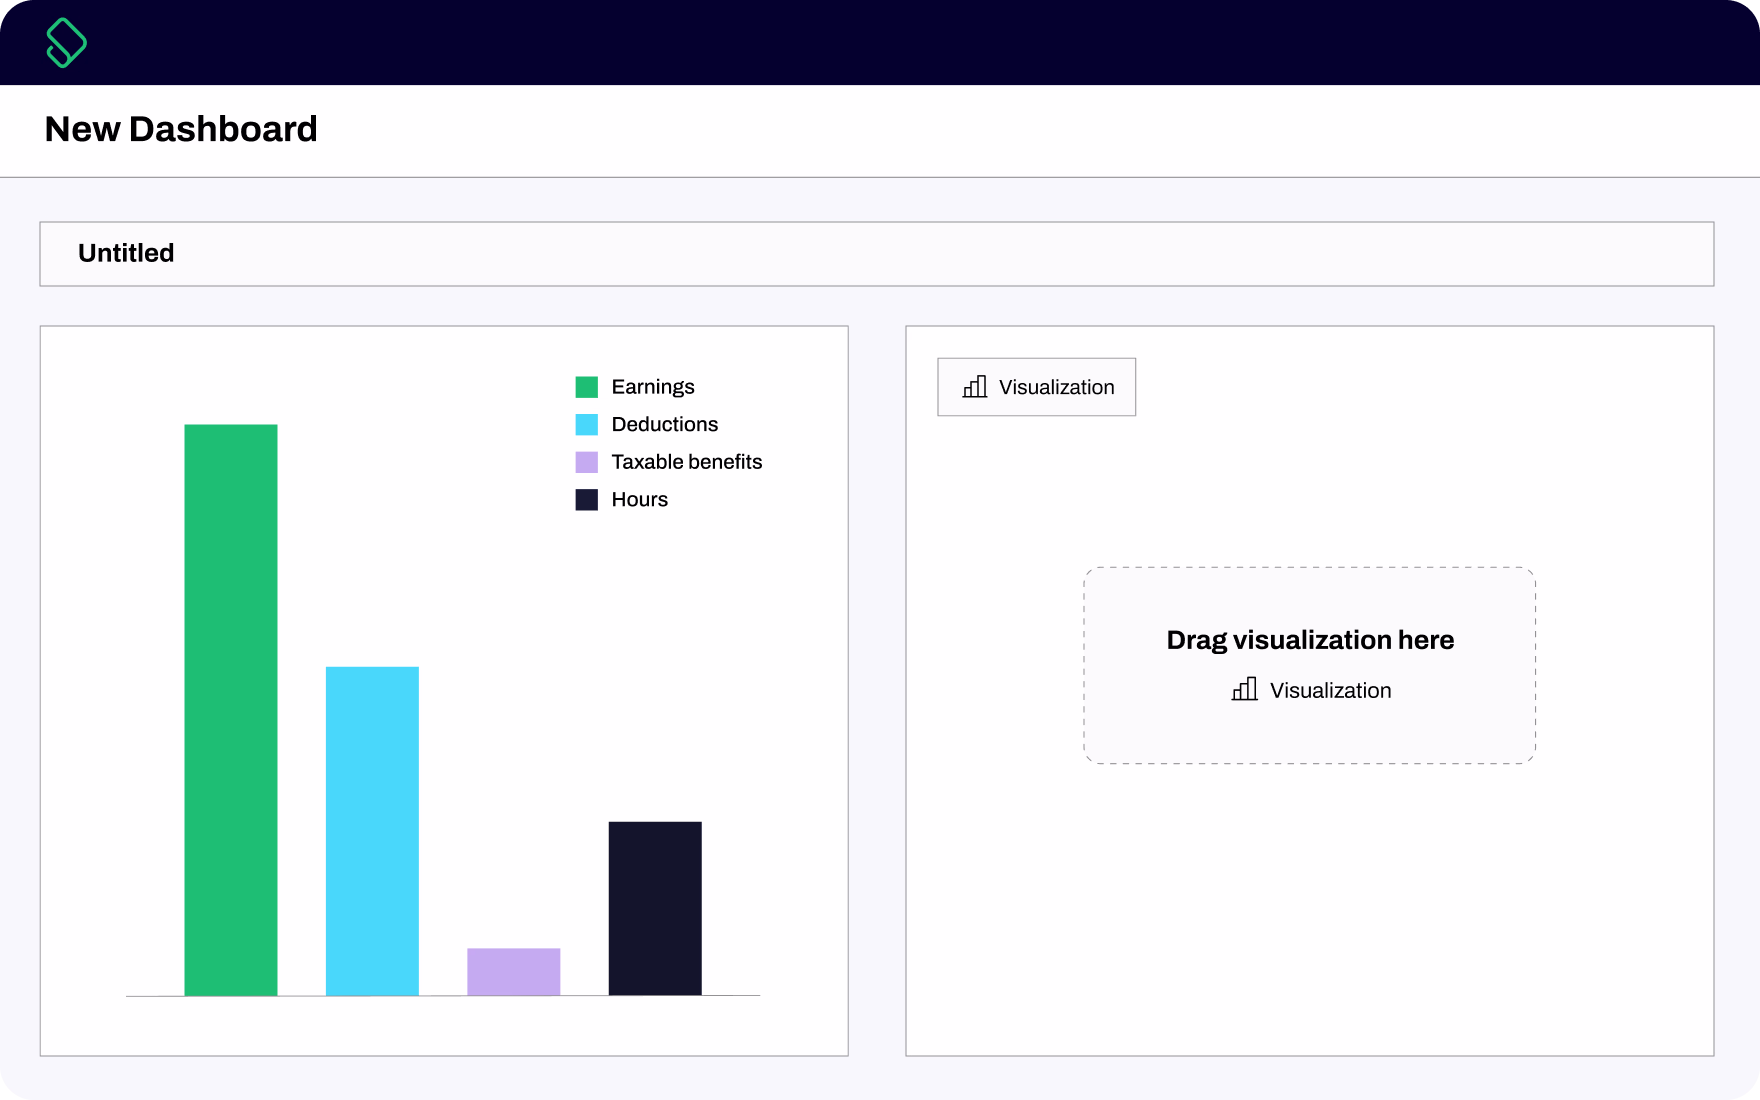
Push Operations’ BI Insights is a customizable reporting workspace designed specifically for restaurant operators. Instead of relying solely on static reports, BI Insights empowers you to build interactive dashboards that reflect the metrics that matter most to your business, including labor costs, sales trends, and workforce performance.
At its core, BI Insights helps you answer business-critical questions such as:
- Are labor costs rising faster than sales?
- Which locations are performing best and why?
- Where are overtime costs increasing?
- Are staffing levels aligned with demand?
With drag-and-drop dashboard building, it’s easy to create custom visualizations using the exact KPIs you want to track. You can combine metrics, filter data by location or time period, and focus on detailed views to uncover what’s driving performance.
Together, these features help create a flexible reporting environment designed for exploring data, sharing insights, and driving action.
Key capabilities include:
- Custom Dashboards and Visualizations: Build reports tailored to your organization’s goals using drag-and-drop tools.
- Prebuilt Industry Dashboards: Start with ready-made restaurant reporting templates and customize from there.
- Real-Time KPI Alerts: Get notified when key metrics, like labor costs or overtime, cross predefined thresholds.
- Interactive Drill-Down Reporting: Move from high-level views to detailed hourly or daily data instantly.
- Multi-Location Visibility: Compare performance across locations in a single view.
- Automated Report Exports: Schedule reports to automatically send to key stakeholders in formats like PDF or Excel.
For multi-location operators, this level of flexibility means leaders can see both the big picture and the data that drives it.
How Restaurant Operators Are Using BI Insights
BI dashboards provide powerful visual insights, but their true value lies in the decisions they help operators make. Here are a few practical ways multi-unit restaurant operators can use BI Insights in their day-to-day operations.

Save Hours of Manual Reporting
For many multi-location operators, reporting still involves exporting data from multiple systems and building spreadsheets manually.
BI Insights reduces that workload by allowing teams to build dashboards once and automatically update them as new data flows in. Reports can also be scheduled to send automatically to leadership teams so everyone stays aligned without additional effort.
The result is less time spent building reports and more time spent making decisions that matter.
Identify Top-Performing Locations
When managing multiple restaurants, it is not always obvious why one location is outperforming another.
With BI Insights, you can compare KPIs such as sales per labor hour, labor percentage, and overtime usage across locations within a single dashboard. If one store consistently achieves better margins, you’re able to find discrepancies in the data to see what’s causing the difference.
One location could be scheduling more efficiently. Another could be overstaffed during slower periods. With these patterns identified, best practices can be applied to other locations.
Keep Labor Costs Aligned With Sales
Labor is one of the largest controllable expenses in the restaurant industry.
BI Insights makes it easier to monitor the relationship between labor and sales in real time. It makes it easy to track metrics such as sales per labor hour, compare actual labor costs to forecasts, and identify shifts where labor may be outpacing revenue.
For example, a dashboard might show that labor costs consistently spike on certain weekdays at specific locations. In response, you can then adjust schedules or optimize shift coverage to bring labor back in line with sales. Over time, even small improvements can have a significant impact on margins.
Spot Overtime Trends Before They Become Costly
Overtime costs often increase gradually before appearing as a major expense on payroll reports.
With BI Insights, you can easily track overtime trends across your entire organization and receive alerts when overtime rises beyond a defined threshold.
Instead of reacting after the fact, BI Insights can help you identify where overtime is occurring and adjust staffing or scheduling before it becomes a recurring issue.
Empower Managers With Location-Level Insights

Head office teams often need enterprise-wide reporting, while location managers need visibility into their own performance.
BI Insights allows users to filter dashboards by location, role, department, or time period. This gives managers the ability to focus on the metrics that matter most to their store while still aligning with company-wide reporting standards.
This means less manual reporting for head office and more ownership for managers at the store level.
See BI Insights in Action
Data shouldn’t just sit in spreadsheets — it should be helping you make better decisions for your business. With BI Insights, restaurant leaders can move beyond static reports and begin exploring their data in ways that reveal trends, uncover opportunities, and improve performance across every location.
Ready to turn your operational data into actionable insights? Get a first look at BI Insights and discover how customizable dashboards can transform the way you run your restaurants.